This week, I continue showcasing the trial run version of my latest app – the Catfish Farm Business Manager. Click below to watch the video guide I recorded today for use by the Catfish Farm CEOs who signed up, to learn how to post entries into the Daily Feed Record Sheet interface in the app,
Apart from explaining how the Summary Report is auto-generated, I’ve also deliberately touched on how I came up with the thinking about putting in the Feeding Response Rating Scale, which the app uses to compute a weighted average index “Cumulative Feeding Response Rate” that tells the farm owner how well the fish are doing via daily, weekly and monthly chart trending.
SCROLL DOWN TO READ THE FULL ISSUE

Tayo Solagbade’s
Performance Improvement IDEAS
(PI Squared) Newsletter
Monday 31st July 2017
![]()
NB: This PI Squared newsletter will be published weekly, on Mondays, in place of the Speaking/Web Marketing IDEAS newsletter, starting from today – 15th February 2016. I’m reinventing my Monday newsletter content and theme, to accommodate my vision of serving the growing audience of serious minded individuals and organizations reaching out to me, with information, education. news and research findings designed to help them do what they do better.
************
![]()
![]()
![]()
![]()
![]()
PII 077: VIDEO – Posting Daily Feed Records into Tayo Solagbade’s Catfish Farm Business Manager spreadsheet App
This week, I continue showcasing the trial run version of my latest app – the Catfish Farm Business Manager. Click here to watch the screenshot demonstration video guide I recorded today for use by the Catfish Farm CEOs who signed up, to learn how to post entries into the Daily Feed Record Sheet interface in the app,
Apart from explaining how the Summary Report is auto-generated, I’ve also deliberately touched on how I came up with the thinking about putting in the Feeding Response Rating Scale, which the app uses to compute a weighted average index “Cumulative Feeding Response Rate” that tells the farm owner how well the fish are doing via daily, weekly and monthly chart trending.
Like I said in the video:
“As a Farm Business Owner running a fish farm operation, you want to get an understanding of what your data means. You don’t just want to keep data for sake of data…or just post it in. It’s not just financial data. THIS is operational data, and it can tell you a lot of things that can help you anticipate what your financial data will look like!
[TIP: You can view large sized screenshots of the different interfaces shown in the video, and mentioned in the transcript in the article titled “Signup to Test Drive (and Own) Tayo Solagbade’s Excel-VB Catfish Farm Business Manager [Evaluation Version]” – click to view now]
######################################
Verbatim Text Transcript from Screenshot Demonstration Video Tutorial STARTS
#######################################
So login. Your getting to this place is something you will have to pick up in the manual I will send to you.
And I want to show you how to use 2 of the most important interfaces in this software for Catfish Farm Business.
The first one is the Pond Feed Records Sheet (PFRS) and I will do another video on the Pond Management Records Sheet (PMRS).
So let’s go to the Pond Feed Records Sheet (PFRS)
Click the button (for it) on the Main Menu…
Now, the first…okay, let’s just not have to see the coding interface…let’s get rid of that…
Right, so the first place you get to…this is the ready to print copy of the Pond Daily Feed Record Sheet…
And there are 2 buttons here,,,”Print Preview – Excluding Tips” and “Print Preview – With Tips”
These are the tips on how to make entries into it (by hand, on paper)
This format was obtained from one of the best practice documents I downloaded from the web…I have links to that that I provide to everybody who gets a copy of this application.
So you can put in these if you want to print with tips. Why would you want to print with tips? Well you want that to be what would be used as instructions by your operatives – Use it to explain to them.
The way this form works: you would make entries of the amount of feed fed to the fish in each pond on a daily basis for the entire week.
So there’s Monday, there’s Tuesday and there’s Wednesday…
So for each day you’ll record the handwritten entry in terms of the Kilograms of feed you fed to the fish. Then in the next column for that day, you will indicate what the feeding response of the fish was. It’s a bit subjective, but generally with training (and experience) people learn to get an estimate on a scale of about 4 different levels of how responsive the fish were.
I will explain that as I go along.
So there are different labels that are used to indicate how responsive the fish were.
Alright, so let’s go back to the Main Menu. So if you want to print it, you just click “”Print Preview – With Tips”.
So you send this to the printer and you give it to your operatives. They can study that and you could use that for training to teach them how to fill in the form. Then when you want.
Then when you want to give them the forms to use, of course, then you’ll click “Print Preview – Excluding Tips”.
And that would actually get the form printed for you, available for you to use without all those tips on it.
Then you’ll make photocopies of that and give to your staff to go ahead and use in taking records from every pond that they put feed in.
Alright, now then you’re now going to go ahead and post entries when they return the forms to you.
You click this button (labeled) “Post Data Entries from Paper”
Alright, this is now the data entry interface in the application for information that is posted into the Daily Feed Record Sheet.
Right. So how do you make entries into it?
This is the first column here…
Now, in the form the person would have indicated the date, because this is a form that is used to capture data from Monday till Sunday.
So, it’s for an entire week (for each pond). S you just click here and choose (a date from in-cell drop menu)
Because this application is a monthly application, it will show you the dates for the entire month.
So you choose whatever month you want, and the application has been configured such that it will indicate Week Numbers.
This is useful when it wants to generate the Weekly Summaries.
Now the next column there, the “Feed Sheet”, that is relevant…you will decide on the numbering system, so you put the value in here…whatever the value is…alright..
Then the “Pond Name, Pond Number” whatever the label or identification method you’re using, you type them here.
Then the type of feed – you indicate that there
And then this is the amount of feed…total amount of feed. Now in this column here (before Monday) you would put in the amount of feed. That’s the total amount of feed meant to be given to the fish each day.
Alright then you see what quantity…because you know the number of fish that are there, you’ve estimated what they’re supposed to be able to consume.
So then you see what is administered on a daily basis and you do a difference between the start and end quantities in your bags on a daily basis.
So, this is Monday, this person says he fed them with 20 kgs of feed and the response of the fish was “E” (for “Excellent”)
As you can see on the scale here, “E” is for “Excellent”, “G” is for “Good”, “F: is for “Fair” and “P” is for “Poor”.
I have just added value by including a “Rating Score” because I felt it made more sense, using a computerized system now.
From paper based system that the best practice people gave use, what I did was to think up a way to do the scoring to rate the feeding response and therefore allow the computer to generate something that we can actually plot in graphs – which is what we have in this application.
So the operative indicates whether it was “Excellent” (or) “Good”, puts the amount of feed for each day, and indicates what the feeding response was using the label, but the computer goes a step further and converts the feeding response into values using a weighted average. I call it “Cumulative Feeding Response Rate”.
So what you have here is 3.14 which is actually a weighted average of the Gs and the Fs and the Es to give you an average for the week. So it’s kind of something that helps
On a daily basis actually, you see a summaries report – the app also converts them into numbers. So you’re able to plot the feeding response in terms of values and see what the trend is like.
And then at the end of the week, it still gives an average, which you can then compare . You can say you want to compare the weekly averages.
So for one week you compare with the other week and see how the Feeding Response has been over time.
It’s always better to study trends as against just looking at isolated values, because they don’t really tell you the full picture.
There’s always a trend when you’re dealing with what is called a Batch Production System -which is what Commercial Fish Production is about.
Alright, then you have a column for observations and all of that. You type that in.
So basically you put in your values and the computer does its entries…So if I were to just do some dummy entries here now…
(Monday) Probably say here “19”, then ii say maybe it’s a “G” for “Good” Feeding Response…
You’ll notice in the right column there, under CUMULATIVE RESPONSE, it’s already computing, doing its averages. But it’s doing a Weighted Average. It’s not just a direct average.
(Tuesday) So then I say maybe 18.5, and I say maybe we have a “G” as well. Good
(Wednesday) I say maybe 21, and I say we have an “E” as well.
(Thursday) I say maybe 17, and I say we have a “P” – maybe there was a problem on that day.
(Friday) And ehm let’s see…this one…maybe let’s make it 19, and then this one (Feeding Response) for 19, that would be “Fair” right?
(Saturday) And then let’s say 20, go back up again, so it’s “Good” “G” – consistent with what we wanted to feed them
(Sunday) Now let’s say this is 19 again and it’s just “Fair” – “F””E” as well.
Alright.
You watch the averages on the right that is the Cumulative Responses, because I think we had that “Poor: you can see how the Cumulative Average for the week – so generally it was “Fair for the week.
So the application also uses the Cumulative Response, the average we’re able to get for the feeding response and categorizes it in terms of whether it was “Good” it was “Excellent”,,,
You don’t have to do that, the computer automatically does that.
You just post in your entries. Get your staff to understand how to use the labels for Feeding Response Rating, and then the application will do its own scoring.
So you can imagine what this can do for you, if the team is trained to know how to give the proper description of the behavior of the fish, and also to feed the fish the right amounts of food.
You can actually use this to get a good indication of how the ponds are performing.
So you might be able to compare one pond with another pond. There are so many possibilities here.
But let’s go and take a look at the SUMMARIES
So when you’re done with this, just click the button here (labeled “View Summaries”)
… To let you see something…
Okay maybe, let me take you back (click “Post Data Entries from Paper”)
We have dates there right? (Under “Week Start Date” i.e. the first date for the week)
We have 26th of May, 2nd of January and all of that…
If I go here (Dates Drop Down Menu at top of worksheet) and I pick 6th of May, this allows you to narrow down to particular days that you want to see values for.
So you can see it allows you to just filter out all other periods and narrow down to a particular period you want to see.
This is a very useful feature.
You click SHOW ALL button (to display the full data)
You can also filter according to Week Numbers. You choose a particular week, and it will actually narrow down to that week, and you can actually print that out.
So that’s another useful feature – because your purpose is to use this application to do what is called Data Analysis for Decision Making.
Right, You want to see your data, you want to see what the wholistic performance of your fish is like, and then use the information you get, to get an understanding or assessment of how well they are doing, and then take a decision or plan for further management.
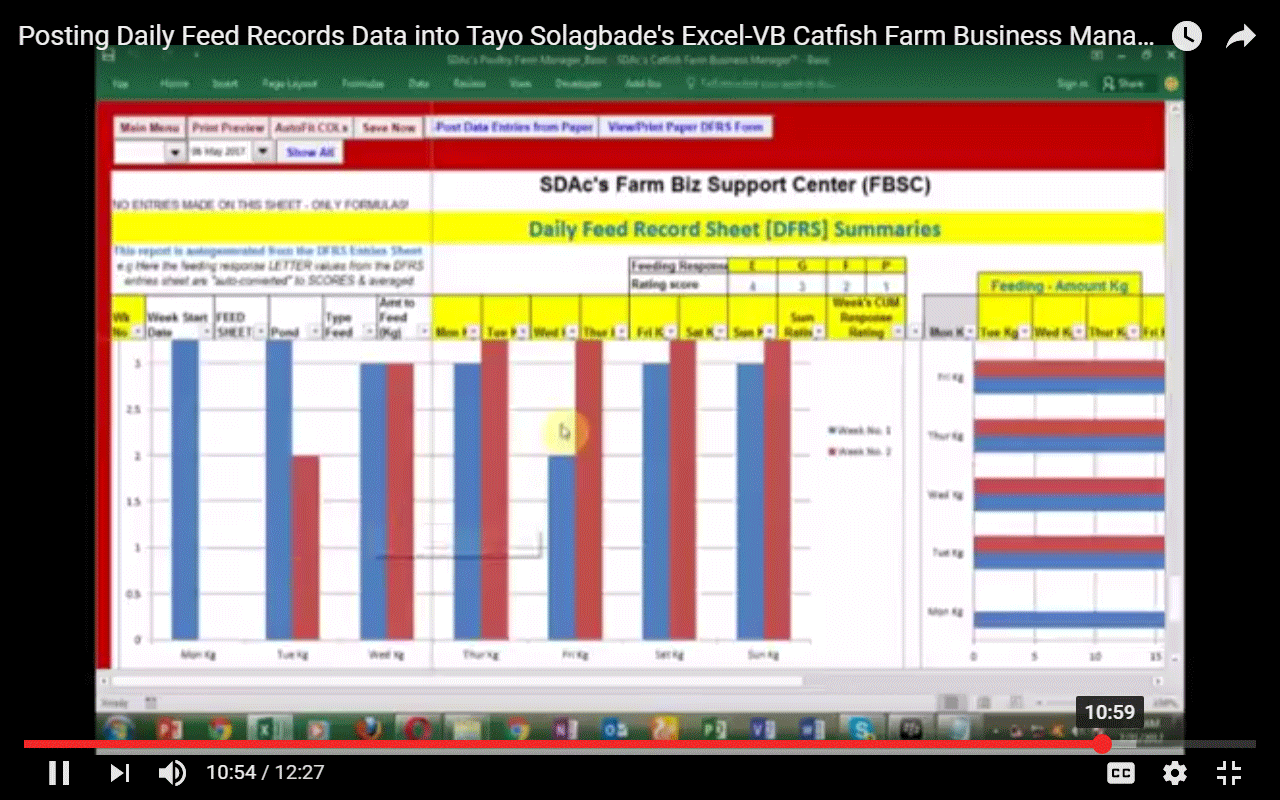
So let’s go to the summary report. This is the summary report, you don’t post any entries here. Based on the entries you’ve made, you generate this report.
Now take a look at this. You can see what it’s done. It’s not the average – you can see it’s brought in the values.
Now, for you to really get a feel for what I’m talking about, look at the graph at the bottom that is automatically plotted.
Take a look at it – that’s the chart that is automatically generated.
The idea is that this chart enables you to look at what we can compare with the other week, on a daily basis. You can see that. Okay. So you look at the performance in terms of feeding response and you can actually get a feel for how they’re doing graphically. The same thing applies to the feeding on the right. You can actually see it there in another column bar.
It allows you to compare one week after the other, so as you add more data, week after week you’re able to compare – all through the rest of the month. On one screen. On what you call one-page sized report formats, you’re able to do this.
And if you want to print…just click PRINT PREVIEW where you can then just send it to the printer. It’s all ready to go.
It’s just for you to choose what you want to see and that’s what will be generated for you and you can actually just send it to the printer. And you’ll have it in your hands. And you can also convert it to PDFs as well, if you have a PDF (creation) application on your system.
Alright, so this is just to give you an idea of how you’re supposed to post entries into the Daily Feed Record Sheet.
I’ve also deliberately touched on how I came up with the thinking about putting in the Rating Scale, for you to understand what the Rating Scale is supposed to do for you.
As a business owner, as a Farm Business Owner running a fish farm operation, you want to get an understanding of what your data means. You don’t just want to keep data for sake of data…or just post it in.
It’s not just financial data. THIS is operational data, and it can tell you a lot of things that can help you anticipate what your financial data will look like!
Alright. So, I’ll do a separate recording for the one on the Pond Management Record Sheet.
Cheers.
Excel-VB Driven Ration Formulator
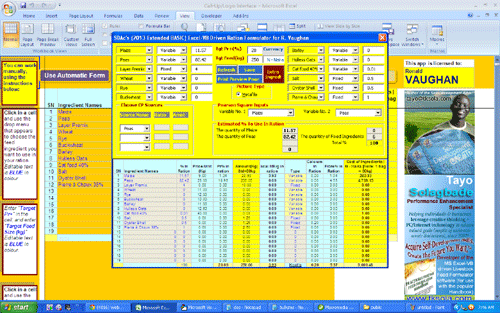
1. Click here to learn more about this app – watch demo videos etc
2. Click here to watch a 4 part video in which I demonstrate how to use this app to formulate rations using real life data sent to me by an Algerian PhD student.
Click here to contact me about purchasing this product.
EXCEL-VB DRIVEN POULTRY LAYER FARM MANAGER SOFTWARE
Click here to download a detailed PDF user guide and watch 15 screen shot user guide tutorials of the Monthly Poultry Farm Manager that I now offer Farm CEOs.
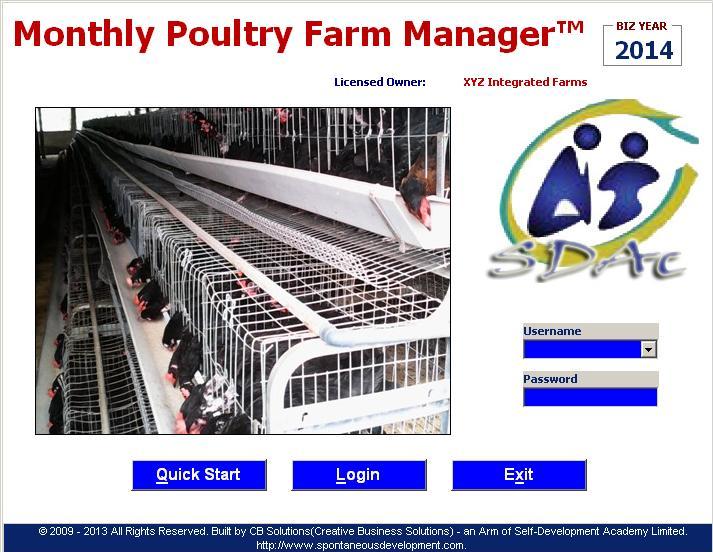
Click here to contact me about purchasing this product.
SDN Blog™
New posts from last week*
Monday:
[Wednesday]:
[Thursday]:
N/A
[Friday]:
N/A
[Saturday]:
N/A
[Sunday]:
[DVAM] Nigerian man narrates the domestic violence he faced in his wife’s hands
The FARM CEO (Issue 89): GET 2 PDF GUIDES ON CATFISH FARM BIZ | INFOGRAPHIC: Find Serious Buyers For Your Property (5 Tips) – by Lanre Karim

Tayo K. Solagbade*
Self-Development/Performance Improvement Specialist
*Best Practice Farm Business Support Specialist & Founder of the MS Excel Heaven Visual Basic Automation Club and Competition
Mobile: +234-803-302-1263 (in Nigeria) or +229-66-122-136 (in Benin Republic)
Tayo K. Solagbade is a Location Independent Performance Improvement
Specialist and Multipreneur (i.e. a highly versatile/multi-skilled entrepreneur), with a bias for delivering Best Practice solutions to Farm Businesses and others.
Since 2002, he has earned multiple streams of income providing individuals and organizations with personal development training and coaching, custom MS Excel-VB solutions, web marketing systems/web hosting, freelance writing services, and best practice extension support services (for farm business owners).
Tayo is the author of the Self-Development (SD) Bible™ and the popular Livestock Feed Formulation Handbook. He is also the developer of its accompanying Excel-VB driven Ration Formulator™ and the Poultry Farm Manager™ software.
He has delivered talks/papers to audiences in various groups and organizations, including the Centre for Management Development, University of Lagos, Christ Baptist Church, Volunteer Corps, Tantalisers Fast Foods and others.
In May 2012 he was the Guest Speaker at the Centre for Entrepreneurship Development’s Annual Semester Entrepreneurial Lecture at Yaba College of Technology in Lagos.
On 1st April 2013, Tayo (who reads, write and speaks the French language) relocated to Cotonou, Benin Republic to begin slowly traveling across the West African region.
His key purpose is to deliver talks, seminars and workshops on his key areas of focus and interest to interested audiences (Email tayo at tksola dot com for details).
In a previous life, before leaving to become self-employed, Tayo served for seven years (October 1994 to December 2001) as a high performing manager in Guinness Nigeria. He rose from Shift Brewer to Training & Technical Development Manager, and later acted in senior roles as Production Manager and Technical Manager.
In addition to constantly challenging the status quo and influencing positive work changes, he built a reputation for using self-taught spreadsheet programming skills (starting with Lotus 1-2-3, and later moving to Excel Visual Basic) – in his spare time – to develop Automated Spreadsheet Applications to computerize manual report generation processes in the departments he worked. Over four(4) of his applications were adopted for brewery level reporting.
Tayo holds a B.Sc degree in Agricultural Extension Services from the University of Ibadan, Nigeria, having graduated top of his class – with Second Class Upper Division honors – in 1992. He is an Associate Member of the UK Institute & Guild of Brewing, a 1997 National Finalist of the Nigerian Institute of Management’s(NIM) Young Managers’ competition, a Certified Psychometric Test Administrator for Psytech UK, innovator of Spontaneous Coaching for Self-Development™ (SCfS-D™), and Founder of the Self-Development Academy (SDAc).
When he’s not amazing clients with his superhuman skills (wink), Tayo works as the creative force behind his Daily Self-Development Nuggets blog – on which he also publishes The Farm CEO Weekly Newspaper (sent via email to paid subscribers) and his Weekly Performance Improvement IDEAS newsletter.
You can connect with him on Twitter @tksola.com and Facebook.
Visit Tayo Solagbade Dot Com, to download over over 10 performance improvement resources to boost your personal and work related productivity.
====
[IMPORTANT NOTE:====
On 4th May 2014, Tayo’s 9 year old domain (Spontaneousdevelopment dot com), which hosted his website, was taken over by Aplus.net.
Within a few days however, Tayo used his advanced self-taught web development skills to build a SUPERIOR “reincarnation” of it the website http://www.tayosolagbade.com.
But updates are still ongoing to URLs bearing the old domain name in most of the over 1,000 web pages, and blog posts he’s published.
If you experience any difficulties finding a page or document, email Tayo at tksola dot com.
Click “Tayo, What Happened to SpontaneousDevelopmentDotCom ?” to read a detailed narrative about how the above event occurred :-))
Here’s an article Tayo wrote, to inspire others to defy adversity, and bounce back to even greater reckoning at what they do EVERY time:
Succeed by Emerging from Adversity Like a Phoenix
(TayoSolagbade.com launches extra Hosting plan with FREE Web Marketing!)
And he wrote the one below, to explain why losing a domain name, no matter how old, NO LONGER determines your online success or otherwise:
A Proven Strategy to Find Profitable Buyers Regardless of Your Domain Name
==================
![]()
![]()
![]()
![]()
![]()
Home |About | Contact | SD Nuggets™ | Speaking/Web Marketing IDEAS | Web Marketing Systems | Freelance Writing | MS Excel® Heaven™ | Cost-Saving Farm Biz Ideas
Source: ExcelVB